Power BI Good Practices
Power BI is a great tool for making reports from a wide variety of data sources accessible to as many people as possible.
By applying a few principles during report design, report response times can be significantly increased and their subsequent maintenance easier.
Although knowledge of SQL is not necessary for the use of Power BI, the learning of minimal knowledge of this language should nevertheless be seriously considered to fully benefit from the capabilities of Power BI.
Foreword
Power BI offers 2 ways to connect to data on which the reports will be based:
- Import - Importing a copy of the data into the Power BI report.
- Direct Query - Direct connection to the data source. No data is imported or copied into Power BI.
This choice is to be made when editing a database connection under Power BI.
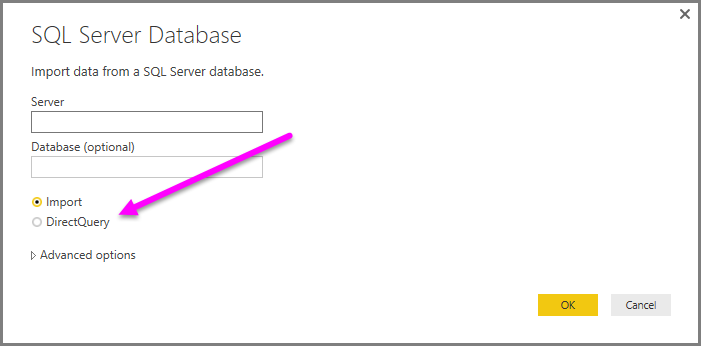
Direct Query mode is preferred when:
- You need query results on data in the database (including the latest insertions and updates)
- You have a large amount of data, too large to be loaded into memory
- You do not need queries to return a result in less than 2 seconds
Optimize the performance of your Power BI reports
Microsoft documentation recommendations:
Use filters
Use filters based on dimension columns and not from fact tables.
Limit the number of visual elements on report pages
Limit the number of visual elements and data to the bare minimum.
The extraction pages are made to deepen a given field in more detail, see https://docs.microsoft.com/en-us/power-bi/power-bi-report-add-filter#add-a-drillthrough-filter and for a demo in video: [YouTube] Drilling into drillthrough in Power BI Desktop
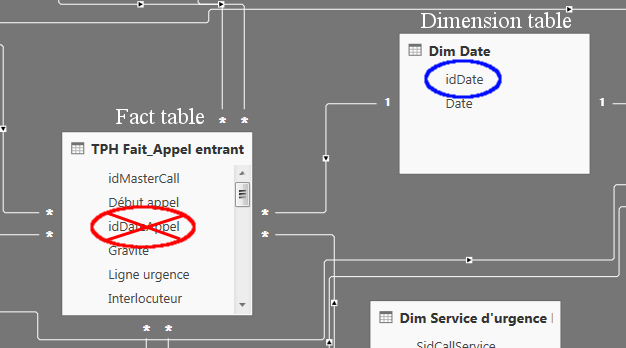
Optimize your model
Optimize your model under Power BI
- Therefore, restrict the data model supporting the report to the data/columns/fields that are strictly necessary, unused tables and columns should be deleted as much as possible. If it becomes necessary to apply a filter to the entire report: pages and elements, it is that this action should have been done at the level of the data source.
- The closer the measures and columns are to the data source, the higher the probability of performance.
So, privilege pure SQL queries as sources of data
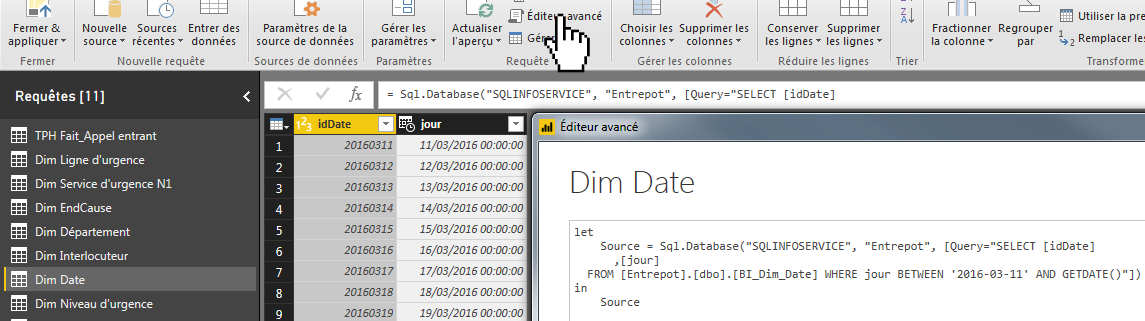
let
    Source = Sql.Database("SQLINFOSERVICE", "Entrepot", [Query="SELECT [idDate], [jour]
      FROM [Entrepot].[dbo].[BI_Dim_Date] WHERE jour BETWEEN '2016-03-11' AND GETDATE()"])
in
    Source
..and avoid extra processing steps in Power BI.
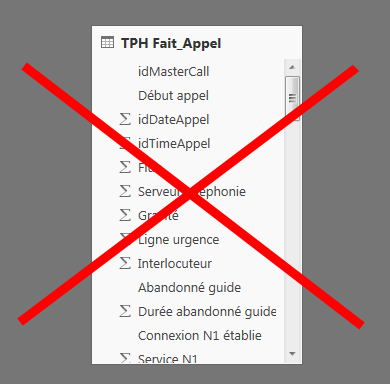
- Beware of DAX functions that require testing each row of a table (such as
RANKXfor example). These functions can, in the worst case, lead to an exponential increase in memory and compute requirements. - Avoid counting elements with an aggregation of type Number (distinct elements) equivalent to a
COUNT DISTINCTin database and prefer Number equivalent to aCOUNTin database.

- Feed your reports with data models of type:
- Star schema, if only one fact table is needed
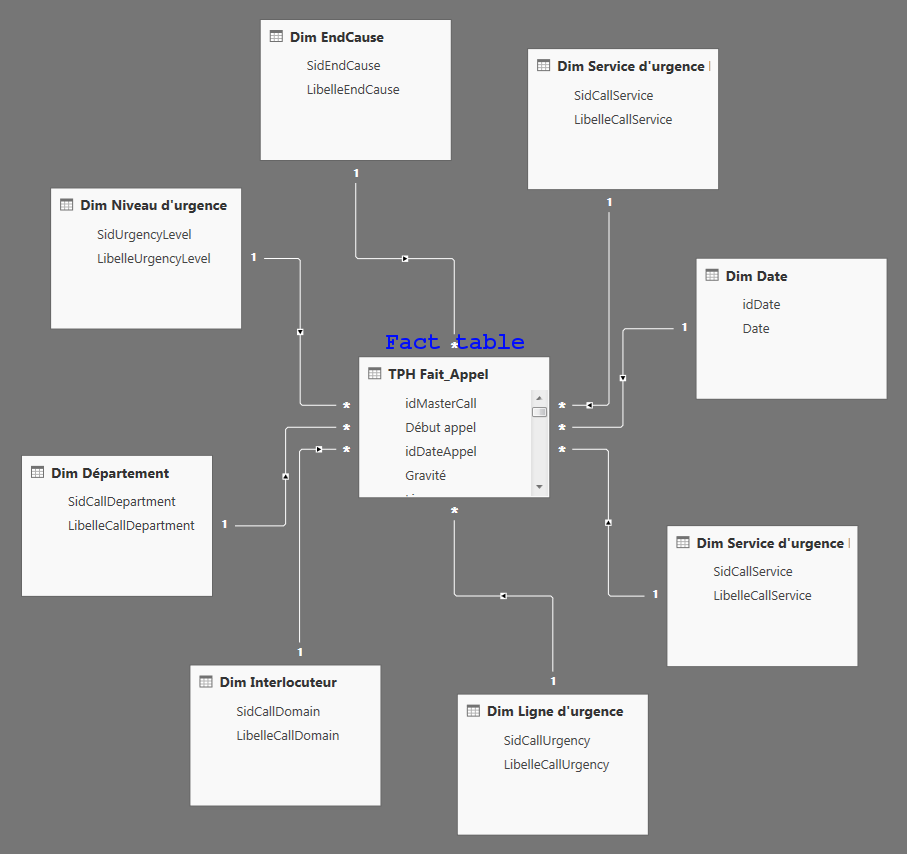
- Constellation schema, if multiple fact tables are needed
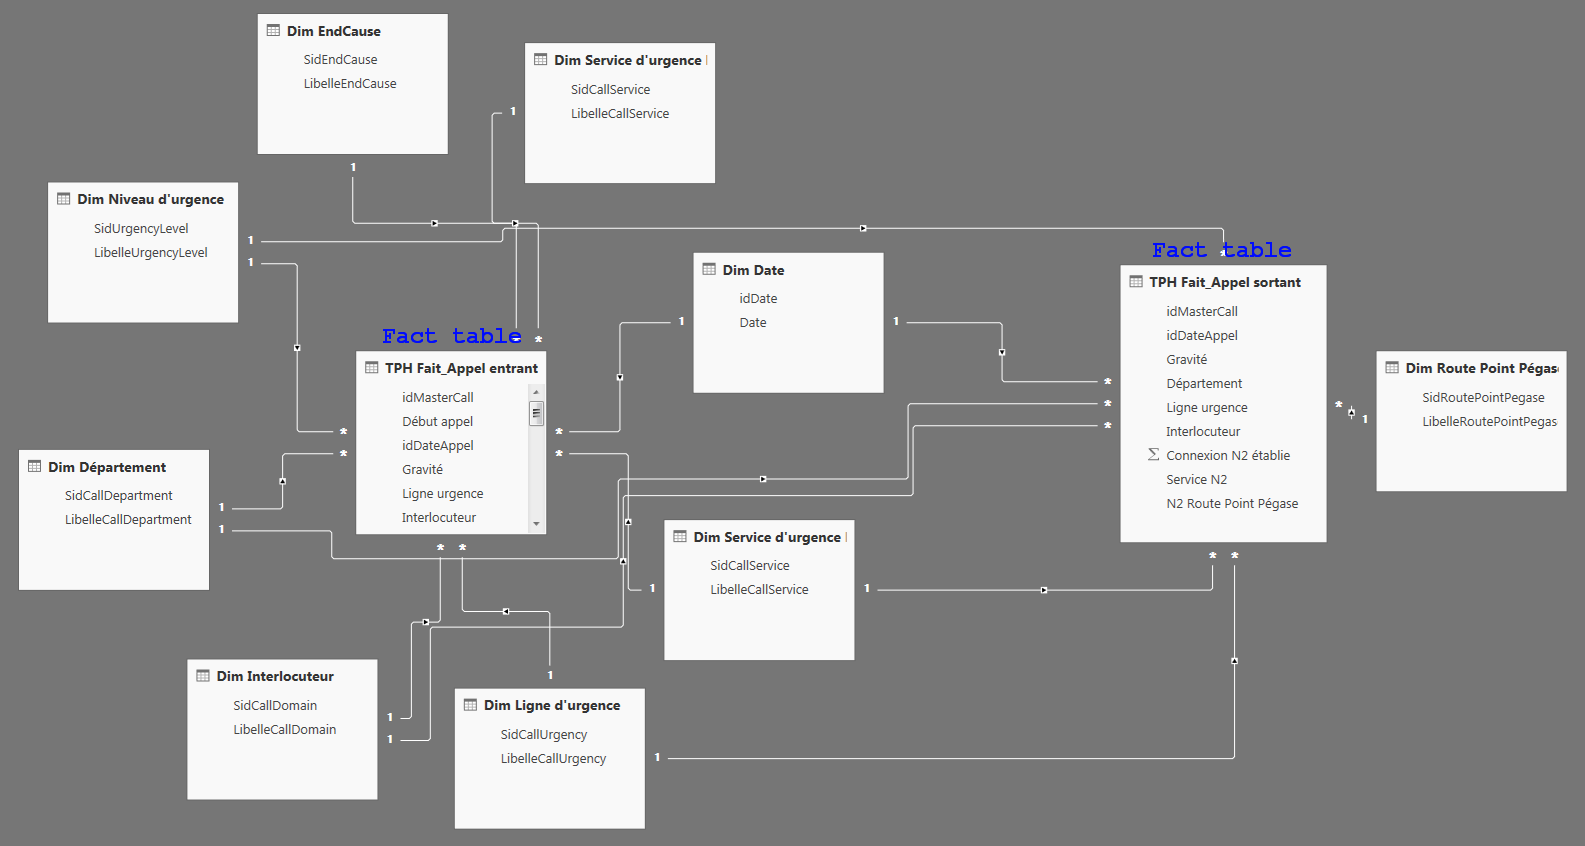
- ... and do not use only fact tables.
- Study the execution plans of your queries under SQL Server Management Studio (Viewing the Estimated Execution Plan)
- Star schema, if only one fact table is needed
Optimize your model in database
- Prefer the type
DATEto typeDATETIMEto fill a date. - For timestamp fields, use the
SMALLDATETIMEtypes if the precision per minute is sufficient orDATETIME2(3)if the precision per second is needed. ADATETIME2(3)type will only consume 6 bytes, whileDATETIMEtypes will consume 8 bytes (see [MS DOC] Date and Time Data Types and Functions (Transact-SQL)) - If the date and time are analysis axes, split this information into 2 foreign key columns (Date Key and Time Key) within the fact table and link these columns with constraints to the corresponding Date and Time dimension tables.
- Consider indexing columns that are heavily used to filter data. For example: create an index on the Date Key and Time Key columns when the data is repeatedly filtered on them.
- Partitioning your data when their volume becomes large will also lead to increase the responsiveness of the reports.
See also
date_range 02/09/2020
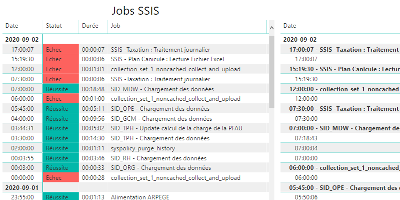
How to monitor SSIS job and package executions.
date_range 15/08/2020
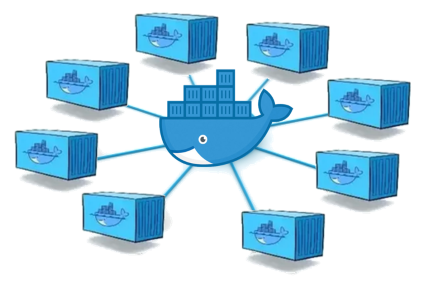
Enable a network connectivity between Docker containers on CentOS 8.
date_range 07/04/2020
Sphinx and GitHub provide an efficient and free way to publish your documentation online. Here we describe how to do so.