Build Vector Tiles and Customize Their Rendering in the Web Browser

Mapbox GL JS is a web mapping library based on WebGL.
Using Mapbox GL JS for serving tilesets is an interesting option especially if rendering a map on the fly in the client web browser is what you are looking for. This ability allows you to render efficiently data-driven map.
The below instructions detail the process for a RHEL/CentOS 7 Linux distribution.
Prerequisites
Install proj.4
- GitHub repo: https://github.com/OSGeo/proj.4
- Website: https://proj4.org/
PROJ is a generic coordinate transformation software, that transforms coordinates from one coordinate reference system (CRS) to another. This includes cartographic projections as well as geodetic transformations.
proj.4 installation from source
git clone https://github.com/OSGeo/proj.4
cd proj.4
./autogen.sh
./configure
make
sudo make install
Install Expat and SQLite
- Expat is a C library for parsing XML, started by James Clark in 1997
- Development tools for the sqlite3 embeddable SQL database engine
sudo yum install expat sqlite-devel
Install GDAL and TippeCanoe
GDAL
GDAL is a translator library for raster and vector geospatial data formats that is released under an X/MIT style Open Source license by the Open Source Geospatial Foundation.
(GDAL must be installed with SQLite and Expat support.)
Download last GDAL from: http://trac.osgeo.org/gdal/wiki/DownloadSource
Install GDAL
./configure
make
sudo make install
Make GDAL tools accessible by adding /usr/local/lib64 to LD_LIBRARY_PATH
export LD_LIBRARY_PATH=$LD_LIBRARY_PATH:/usr/local/lib64
Check ogr2ogr gdal tool version
ogr2ogr --version
GDAL 2.3.1, released 2018/06/22
Tippecanoe
Tippecanoe enable to build vector tilesets from large collections of GeoJSON features.
Install Tippecanoe
git clone https://github.com/mapbox/tippecanoe
cd tippecanoe
make
sudo make install
Generate Your Own Vector Tiles
Download any OpenStreetMap .pbf file you would like to render.
wget https://download.geofabrik.de/europe/great-britain/england/greater-london-latest.osm.pbf
The .pbf file itself can be thought of as a database. GDAL (ogr2ogr) will automatically view the .pbf as having 5 tables: points, lines, multipolygons, multilinestrings (routes), other_relations (osm relations). The osmconf.ini file tells GDAL what columns you want in your tables. Columns are the key name from key=value tag pairs in OSM. (Source: User:Bgirardot/How To Convert osm .pbf files to Esri Shapefiles)
My osmconf.ini file define the [lines] information that way:
[lines]
# common attributes
osm_id=yes
osm_version=no
osm_timestamp=no
osm_uid=no
osm_user=no
osm_changeset=no

# keys to report as OGR fields
attributes=name,highway,waterway,aerialway,barrier,man_made

# type of attribute 'foo' can be changed with something like
#foo_type=Integer/Real/String/DateTime

# keys that should NOT be reported in the "other_tags" field
ignore=created_by,converted_by,source,time,ele,note,openGeoDB:,fixme,FIXME
# uncomment to avoid creation of "other_tags" field
#other_tags=no
# uncomment to create "all_tags" field. "all_tags" and "other_tags" are exclusive
#all_tags=yes

#computed_attributes must appear before the keywords _type and _sql
computed_attributes=z_order
z_order_type=Integer
# Formula based on https://github.com/openstreetmap/osm2pgsql/blob/master/style.lua#L13
# [foo] is substituted by value of tag foo. When substitution is not wished, the [ character can be escaped with \[ in literals
# Note for GDAL developers: if we change the below formula, make sure to edit ogrosmlayer.cpp since it has a hardcoded optimization for this very precise formula
z_order_sql="SELECT (CASE [highway] WHEN 'minor' THEN 3 WHEN 'road' THEN 3 WHEN 'unclassified' THEN 3 WHEN 'residential' THEN 3 WHEN 'tertiary_link' THEN 4 WHEN 'tertiary' THEN 4 WHEN 'secondary_link' THEN 6 WHEN 'secondary' THEN 6 WHEN 'primary_link' THEN 7 WHEN 'primary' THEN 7 WHEN 'trunk_link' THEN 8 WHEN 'trunk' THEN 8 WHEN 'motorway_link' THEN 9 WHEN 'motorway' THEN 9 ELSE 0 END) + (CASE WHEN [bridge] IN ('yes', 'true', '1') THEN 10 ELSE 0 END) + (CASE WHEN [tunnel] IN ('yes', 'true', '1') THEN -10 ELSE 0 END) + (CASE WHEN [railway] IS NOT NULL THEN 5 ELSE 0 END) + (CASE WHEN [layer] IS NOT NULL THEN 10 * CAST([layer] AS INTEGER) ELSE 0 END)"
Convert .osm.pbf data to GeoJSON format specifying the layer of data to extract, here: lines
ogr2ogr -f 'GeoJSON' -s_srs 'EPSG:4326' -t_srs 'EPSG:4326' 'Greater London.json' 'Greater_London.osm.pbf' lines
Having our data in a GeoJSON file, we can generate tiles that way:
tippecanoe --no-feature-limit --no-tile-size-limit --include={"osm_id","highway"} --maximum-zoom=16 --output-to-directory "Greater_London" 'Greater_London.json'
Check how your data has been encoded inside a tile (having a tile/a file: ./Greater_London/8/127/84.pbf, I want to read the first 500 characters)
tippecanoe-decode ./Greater_London/8/127/84.pbf 8 127 82 | head -c 500
I get (The output below has been formatted after the command)
{
   "type":"FeatureCollection",
   "properties":{
      "zoom":8,
      "x":127,
      "y":82
   },
   "features":[
      {
         "type":"FeatureCollection",
         "properties":{
            "layer":"Greater_London",
            "version":2,
            "extent":4096
         },
         "features":[
            {
               "type":"Feature",
               "properties":{
                  "osm_id":"3702620",
                  "highway":"residential"
               },
               "geometry":{
                  "type":"LineString",
                  "coordinates":[[-0.499535,53.343583],[-0.501251,53.344813],[-0.502625,53.347272],[-0.504341,53.347887]]
               }
            },
            {
               "type":"Feature",
               "properties":
Render your tiles with Mapbox GL JavaScript library
Under your web server directory create a new directory
mkdir serving_custom_tiles_demo
In it edit an index.html file
<!DOCTYPE html>
<html>
<head>
  <meta charset="utf-8" />
  <title>Map</title>
  <meta name="viewport" content="initial-scale=1,maximum-scale=1,user-scalable=no" />
    <script src='https://api.tiles.mapbox.com/mapbox-gl-js/v0.50.0/mapbox-gl.js'></script>
    <link href='https://api.tiles.mapbox.com/mapbox-gl-js/v0.50.0/mapbox-gl.css' rel='stylesheet' />
  <style>
    body { margin:0; padding:0; }
    #map { position:absolute; top:0; bottom:0; width:100%; }
  </style>
</head>
<body>
  <div id="map"></div>
  <script>
    mapboxgl.accessToken = "not-needed-unless-using-mapbox-styles";
    var map = new mapboxgl.Map({
        container: "map",
        style: "base_style.json",
        center: [0.1278, 51.5074], // center of London
        minZoom: 5,
        zoom: 13,
        maxZoom: 16
    });
    map.addControl(new mapboxgl.NavigationControl());
  </script>
</body>
</html>
Move your tiles previously generated under your web server directory, making your tiles reachable in the browser from: http://localhost/tiles/Greater_London/{z}/{x}/{y}.pbf
Edit also a Javascript file base_style.json defining your custom rendering style:
{
  "version": 8,
  "name": "Custom",
  "metadata": {
    "mapbox:autocomposite": true
  },
  "sources": {
    "composite": {
      "type": "vector",
      "tiles": [
        "http://localhost/tiles/Greater_London/{z}/{x}/{y}.pbf"
      ],
      "minzoom": 0,
      "maxzoom": 15
    }
  },
 "layers": [
    {
      "id": "background",
      "type": "background",
      "paint": {
        "background-color": "#e3decb"
      }
    },
  {
            "interactive": true,
            "layout": {
                "line-cap": "butt",
                "line-join": "miter"
            },
            "filter": [
                "all",
                [
                    "==",
                    "$type",
                    "LineString"
                ],
                [
                    "all",
                    [
                        "in",
                        "highway",
                        "motorway",
                        "motorway_link",
                        "primary",
                        "primary_link ",
                        "secondary",
                        "secondary_link ",
                        "residential",
                        "tertiary",
                        "tertiary_link ",
                        "trunk",
                        "trunk_link",
                        "street",
                        "street_limited",
                        "service",
                        "track",
                        "pedestrian",
                        "path",
                        "link"
                    ]
                ]
            ],
            "type": "line",
            "source": "composite",
            "id": "tunnel_minor",
            "paint": {
                "line-color": "#efefef",
                "line-width": {
                    "base": 1.55,
                    /***
                    *  Zoom functions allow the appearance of a map feature to change with map’s zoom level.
                    *  Zoom functions can be used to create the illusion of depth and control data density.
                    *  Each stop is an array with two elements: the first is a zoom level and the second is
                    *  a function output value.
                    ***/
                    "stops": [
                    	// zoom is 4 -> the line width will be 0.25px
                        [4, 0.25],
                        // zoom is 20 -> the line width will be 30px
                        [20, 30]
                    ]
                }
            },
            "source-layer": "Greater_London"
        }
  ]
}
Check Mapbox Style Specification to know more about the above properties used.
Notice that the source-layer property should correspond to the layer property seen before in a .pbf tile.
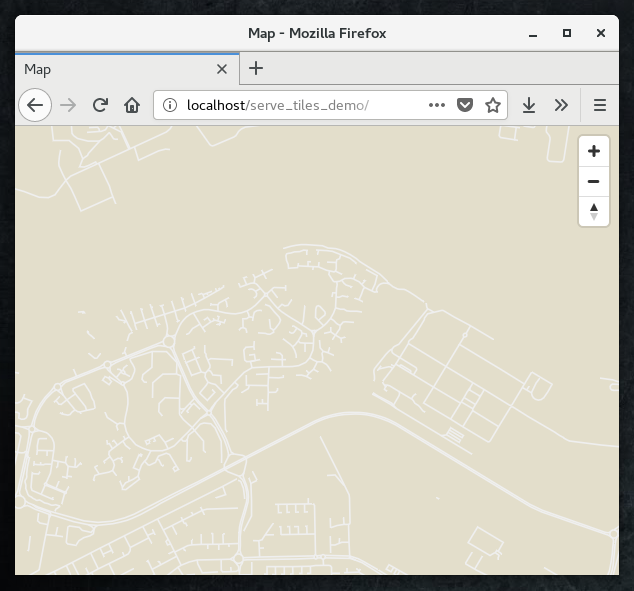
If Apache can read your tiles you should be able to see a rendering of it in a web browser at: http://localhost/serving_custom_tiles_demo
See also
date_range 02/09/2020
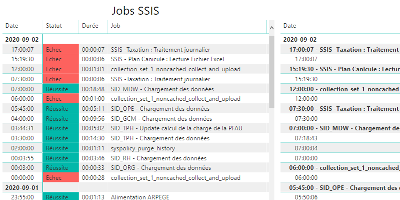
How to monitor SSIS job and package executions.
date_range 15/08/2020

Enable a network connectivity between Docker containers on CentOS 8.
date_range 07/04/2020
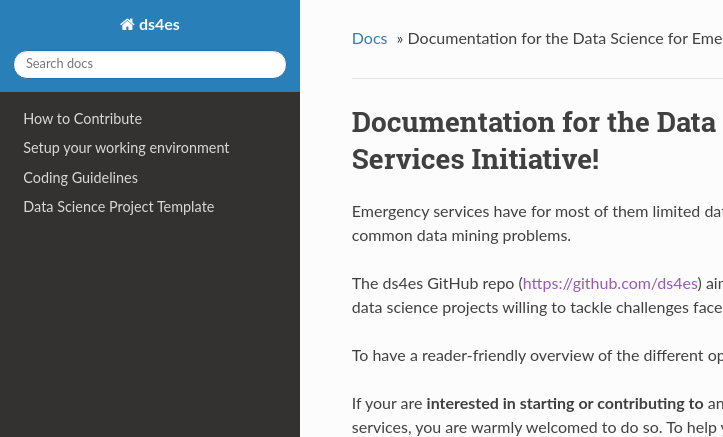
Sphinx and GitHub provide an efficient and free way to publish your documentation online. Here we describe how to do so.