Reaching the Optimal Dispatch for an Emergency Dispatch System
Nowadays emergency services have a great opportunity to improve their service, thanks to the latest technical advances. By giving managers a better view of the actual coverage of the population and optimizing the relief allocation process, resources will be better exploited and more lives will be saved. Actual emergency dispatch systems are not optimal. An optimal engagement of a rescue team following an emergency call does not necessarily result in the assignment of the one offering the shortest transit delay. It should be used in cases where the urgency is known. However, this selection should be put into perspective for situations that are less critical. For these less critical cases, the service coverage preservation should be taken into account in order to ensure a good quality of service for emergency assistance requests with proven severity. Sadly, it is not what current systems do. This article exposes this problem and technical solutions to resolve it.
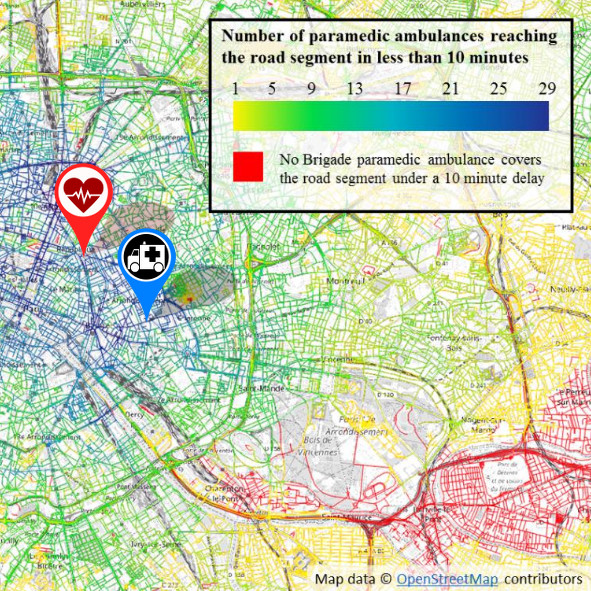
Today’s technological progress allow you with the computing power of a netbook to get the response capacity of each road segments of a Brigade (that is around 140 000 for Paris as for London) in less than a second. Sadly most of emergency services do not have such a precise information, as for example the Paris Fire Brigade with only a 70 pixels resolution information to manage their ressources and taking seconds to be displayed.
Here, I will show you that :
- a high resolution coverage capacity of a Brigade can be computed in less than a second,
- why it's important
- and how we can improve the efficiency of an emergency service with that information.
view_carousel London Tech Week 2018 Presentation
What is the basis of an emergency service’s effectiveness?
Like many other activities, the ability to take the right decision at the right time.
Either for an emergency dispatch system, its ability to allocate the most suitable team for a given request.
And with thousands of daily calls, most of which are not what we define as an emergency, the challenge relief services are facing is to maintain enough units to respond to potential future critical demands.
But how are operators doing this? How do they decide to send a team over another estimated as being faster to get to the scene in order to maintain a good quality of service for future requests?
It seems that all our current allocation systems present more or less lack of information so that operators can’t actually make an optimal allocation decision.
Currently, a call processing operator is sending a rescue team using the following information:
- He or she assesses the severity of the request and whether or not an emergency team has to be sent, usually based on a decision support tree
- If needed, he/she can visualize the location of the demand on a map
- Finally, the system proposes various allocation options with estimated delivery times for the different teams
Do you think that with this information, it is easy for allocators to decide which team is the optimal one?
Let’s see..
“And there are some very very difficult decisions to be made by the allocators, which one do I hold, which one do I send? … you have to make that decision, split second … send don’t send .. it’s hard”
So, indeed, it is a difficult decision.
And why is it difficult? … let’s take an example … with the following call … Is it difficult to choose whether or not to allocate a team, and which one to allocate?
For this case it’s obvious, just send the fastest one that will be able to arrive on scene. The problem is when some of the cases are not proven to be urgent, and allocating a team can potentially strip an area of future requests truly critical
That’s the problem.
Current systems do not specify to the operators, the consequence of their allocation decision. They do not show them the resulting coverage of the population at the time of the dispatch decision. They do not show them the population percentage covered below the threshold of quality of service.
Before going further I need you to have in mind 2 important concepts of operations management for emergency services. To effectively manage an emergency service the concept of coverage of the population is important …, and we can split it into 2 types:
- The immediate response - relying on: How long will it take for a first team to reach a location?
- And the response capacity - How many teams can be on site within a given timeframe? (for example, the target timeframe for London Ambulance Service is 8 minutes)
The latter is the most important and you will have a representation of it below.
With those notions in mind, let’s see what might look like an effective dispatch application.
As example, let’s say that we are about to send a team for a non-critical request while the operational coverage is suffering due to a strong demand of relief, leading to 30% of the units remaining available.
Dispatch option 1
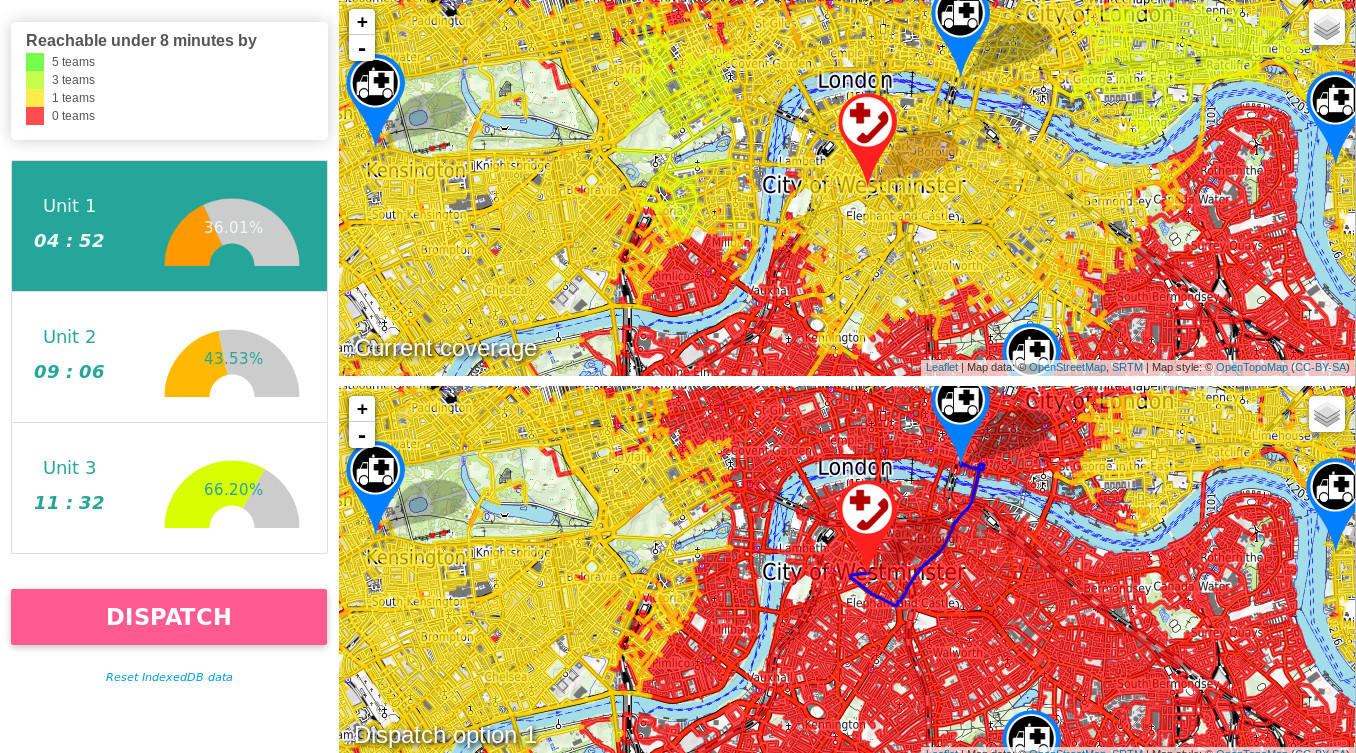
This application has been setup to recover the first 3 fastest units (this is of course just a parameter modifiable, if needed). The allocation options are now presented with 2 maps:
- One showing the response capacity before allocation, at the top
- And after allocation for the bottom one
The ambulances are represented by blue points of interest and the request by a red one. For the road segments, red means that those segments are not reachable by a team under the 8 minutes quality of service threshold. For those reachable by 1 to 5 teams they are assigned a color from yellow to green, green if 5 teams are able to reach them under 8 minutes. Cartographic representations are really great for quickly assessing the service situation.
Dispatch option 2
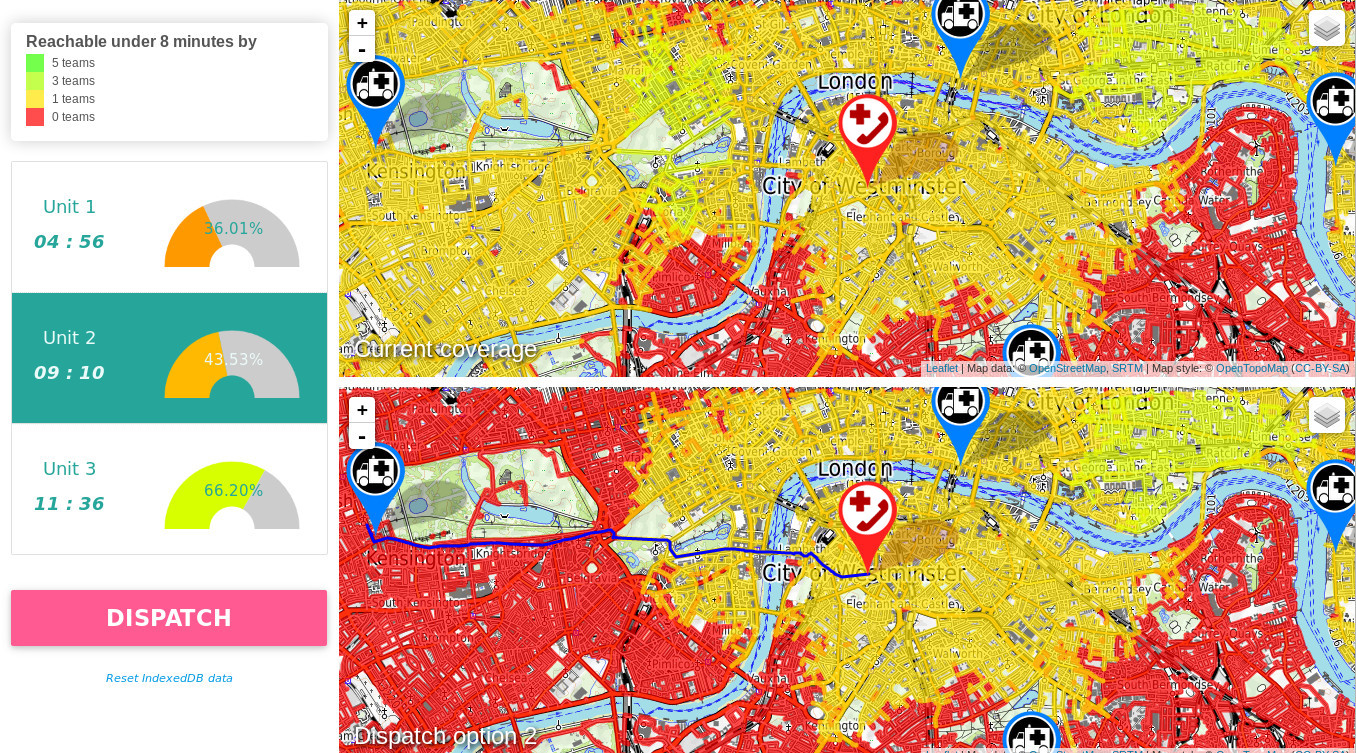
But in some cases, things may not be so obvious, so for that, each allocation option is associated with an estimate of the population covered under 8 minutes.
Even if the interface could have been more exhaustive, I hope it’s made it obvious the benefits of such information in a dispatch application. 0
Dispatch option 3
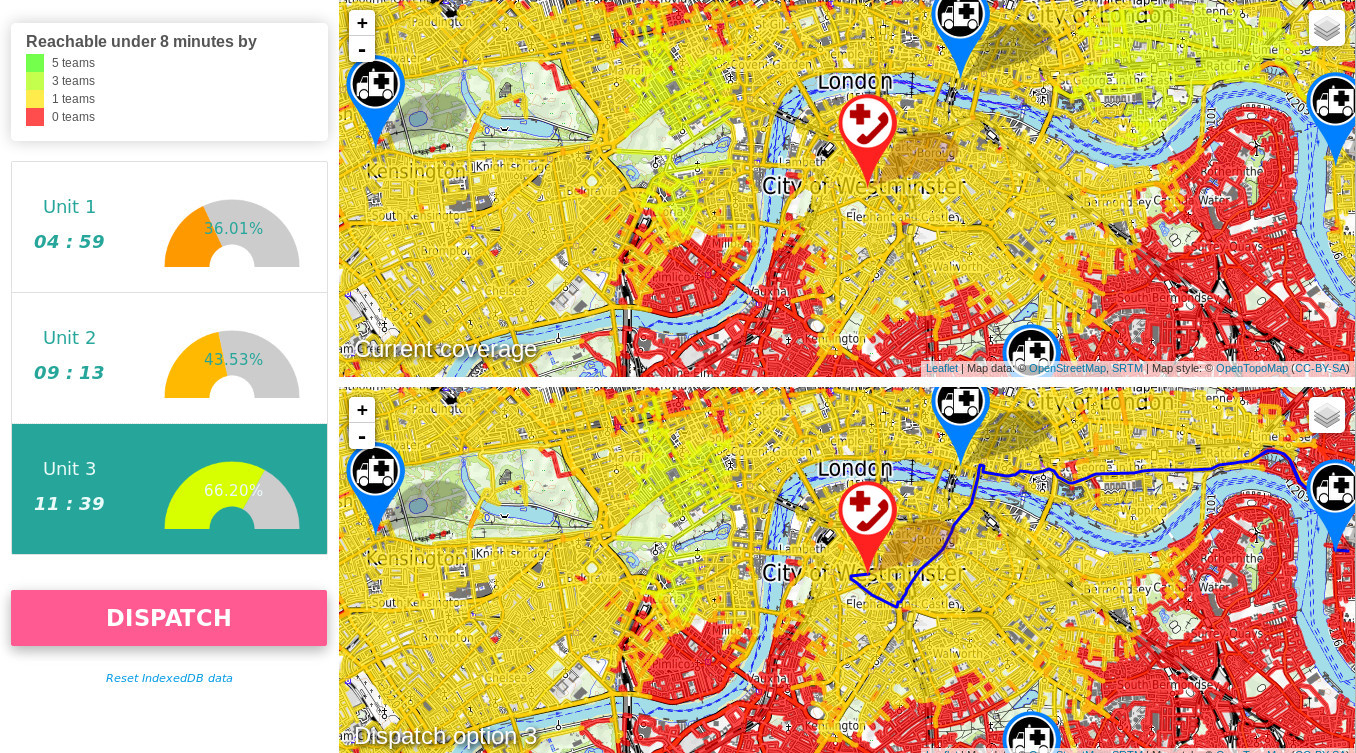
-
touch_appThe example above refers to a dispatch situation, but what about monitoring an entire brigade jurisdiction?An emergency operations centre needs to have the big picture of the scene. How fast and precise this information can be computed?
Lets take as example the fire coverage of the Greater London area whose OpenStreetMap data hold 144 087 road segments. To make that test, we need a few assumptions, let's consider those parameters:- the brigade consists of 142 fire trucks (declared in 2016)
- 80% of the units are still available
- it takes 1 minute from the call to engage a team
- the trucks speed is equivalent to 70% of the speed limit
- we are interesting by the coverage for a response capacity under 10 minutes
The Greater London coverage capacity over 144 087 road segments has been computed in less than a second (on a netbook Acer Spin 3, Intel Core i3), making of this information relevant and usable to conduct ongoing operations.[0] Greater London [1] Greece [2] Hungary [3] New-York [4] Iceland [5] Ile-de-France [6] Luxembourg [7] Andorra Select an area to benchmark the capacity response computation time: 0 *** Will be load: /home/benjamin/Documents/data/PBF/Greater London.osm.pbf *** Graph loading from PBF file!! Scanning OSM PBF data to determine IDs Not all modelling nodes are routing nodes Finished scan, needed 2165263 musec. OSM ID range goes up to 8589934592 for routing nodes. OSM ID range goes up to 8589934592 for modelling nodes. OSM ID range goes up to 1073741824 for routing ways. Found 211342 routing nodes. Found 576308 modelling nodes. Found 144087 routing ways. Start computing ID mappings Finished, needed 471003 musec. Scanning OSM PBF data to load routing arcs [...] Finished, needed 16730 musec. Sorting forbidden turns Finished, needed 529 musec. Extracted 2439 forbidden turns. Contraction Hierarchy built in: 0 min 6 sec 177 msec 285 µs. *** Parameterization *** Number of units deployed randomly on the graph [default = 70]: 114 Time (seconds) under which the coverage will be assessed [default = 300]: 378 Random positionning of 114 intervention units on the graph Assessment of the coverage capacity.... The road segment with the highest coverage is reachable by 13 unit(s) COVERAGE COMPUTED IN: 0 min 0 sec 909 msec 356 µs
There is still to render it of course... for that the trick is to use a JS library like Mapbox GL. Believe me, such a precise information displayed on map is what any emergency control center manager would have to have, but rare are the emergency services having something close to that.
I hope not being the only one who finds that this is not a gadget but that this tool has a real interest in improving the quality of service for an emergency service. And do not see this as an end in itself, but as a brick needed and suitable for outstanding future applications that will increase the capacity of the emergency services in terms of control of their coverage and responsiveness.
Because after being able to assess more accurately the transit of the rescue units, the current coverage and after dispatch.
Well … It seems that any responsible, responsive and dedicated professional of an emergency service will have in mind to push the possibilities offered by geographic information systems further with the indoor mapping.
The exploitation of the internal cartography will be incredible for the emergency services if they really invest in it. The centres of management and coordination will no longer have to envy the management rooms of the Hollywood super productions.
The next revolution of the control of emergency operations will not be the ability to predict

…where an emergency call will take place, with 3 mediums floating in a pool as in the movie minority report.
The revolution that we could benefit from, if we really invest in it, is to implement and take advantage of the possibilities offered by the indoor mapping. Decision makers should really fight for it.
But let’s start with the beginning, a real control of our road network, dispatch, and a true mastery of the operational coverage is a necessary first step to achieve before going further.
A lot of good thing, amazing thing are achievable, a true control and vision for managers of their units is possible, but for that: investments, qualified people and a lot of work are needed.
See also
date_range 02/09/2020
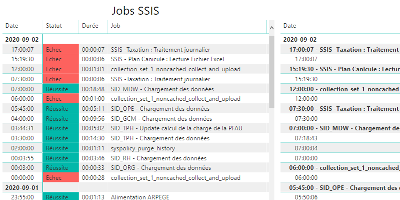
How to monitor SSIS job and package executions.
date_range 15/08/2020
Enable a network connectivity between Docker containers on CentOS 8.
date_range 07/04/2020
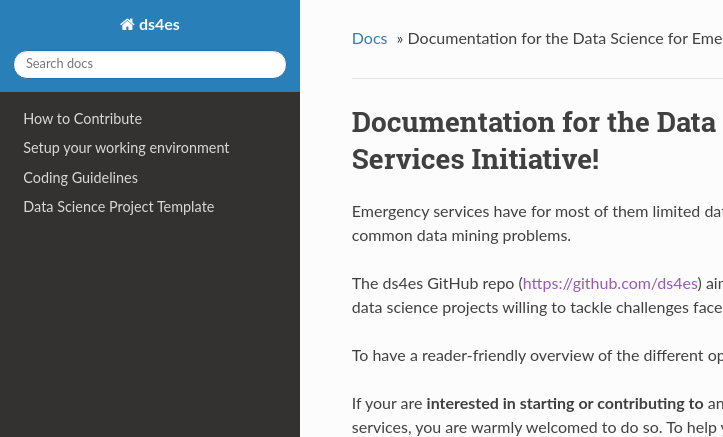
Sphinx and GitHub provide an efficient and free way to publish your documentation online. Here we describe how to do so.